Why Training Load Metrics Matter
The impulse-response model, first proposed by Banister, Calvert, Savage, and Bach (1975), treats every training session as an impulse that produces two competing responses: a fitness gain and a fatigue cost. Both responses decay over time, but at different rates. Subsequent work has validated and extended the model across endurance disciplines (Busso, 2003), and it provides the mathematical foundation for the three metrics described below.
These metrics give athletes and coaches an objective way to track the balance between stress and recovery. Subjective perception of effort and readiness, while valuable, does not reliably reflect cumulative training load on its own (Foster, 1998).
The Three Core Metrics
CL, Chronic Load (Fitness)
CL is an exponentially weighted moving average of daily training load, typically calculated with a time constant of 42 days (Coggan, 2003). Because of this long time constant, CL changes slowly. It takes weeks of consistent training to raise it, and it begins to decline within days once training stops.
A higher CL reflects a greater capacity to absorb and respond to training. In practical terms, it represents accumulated fitness. Banister’s original model used a 45-day time constant for the fitness component (Banister et al., 1975); the 42-day convention became standard through the work of Coggan and its adoption in the Performance Management Chart on platforms like TrainingPeaks (Coggan, 2003).
AL, Acute Load (Fatigue)
AL uses the same exponentially weighted average, but over a shorter window of roughly 7 days. It captures recent training stress and responds quickly to changes in load. A hard training week pushes AL up; a few rest days bring it back down.
The 7-day time constant corresponds to the fatigue component in the Banister model, which decays faster than the fitness component (Banister et al., 1975). This difference in decay rates is the basis of supercompensation: fitness outlasts fatigue, so after a recovery period the athlete emerges fitter than before the training block.
Form (Freshness)
Form is CL minus AL. When CL exceeds AL, the value is positive, meaning the athlete is relatively rested relative to their fitness level. When AL exceeds CL, the value is negative, reflecting accumulated fatigue.
During hard training blocks, Form is usually negative. This is expected and necessary, because the stimulus required to drive adaptation temporarily pushes fatigue above fitness. Problems arise when Form stays deeply negative for weeks without planned recovery (Meeusen et al., 2013).
For competition, athletes generally target Form values between +5 and +25 by reducing training volume in the days before the event while keeping enough intensity to prevent CL from dropping too far (Mujika & Padilla, 2003).
Managing the Three Metrics Through a Season
A well-structured training plan moves through phases that manipulate these metrics in sequence.
During base building, CL rises gradually while Form sits between roughly -10 and -30. The rate of CL increase matters: Foster (1998) found that spikes in training load relative to an athlete’s recent history correlate with higher injury and illness risk. A common guideline is to increase CL by no more than 5 to 7 points per week, though individual tolerance varies.
During intensity phases, AL rises during hard weeks and drops during recovery weeks. This oscillation allows adaptation without chronic fatigue accumulation.
During a taper, the goal is to lower AL while preserving as much CL as possible, letting Form rise into positive territory. A meta-analysis by Bosquet, Montpetit, Arvisais, and Mujika (2007) found that tapers lasting 8 to 14 days with a 40 to 60 percent reduction in training volume produced the largest performance gains across endurance sports.
On race day, the target is positive Form combined with CL near its seasonal peak.
Common Mistakes
Raising CL too fast. Aggressive increases in training load carry risk. Gabbett (2016) showed that a high acute-to-chronic workload ratio is a strong predictor of injury across multiple sports. Building CL steadily over weeks is safer than trying to compress the process.
Ignoring sustained negative Form. Training with Form below -20 for several consecutive weeks increases the risk of non-functional overreaching or overtraining syndrome. The joint consensus statement by the European College of Sport Science and the American College of Sports Medicine recommends planned recovery periods to prevent the transition from functional overreaching to the more serious non-functional form (Meeusen et al., 2013).
Tapering too long. A taper beyond two weeks causes CL to drop substantially, which can offset the freshness gained from reduced fatigue. Mujika and Padilla (2003) found that progressive tapers of one to two weeks preserved fitness better than longer rest periods.
How 400WFTP Uses These Metrics
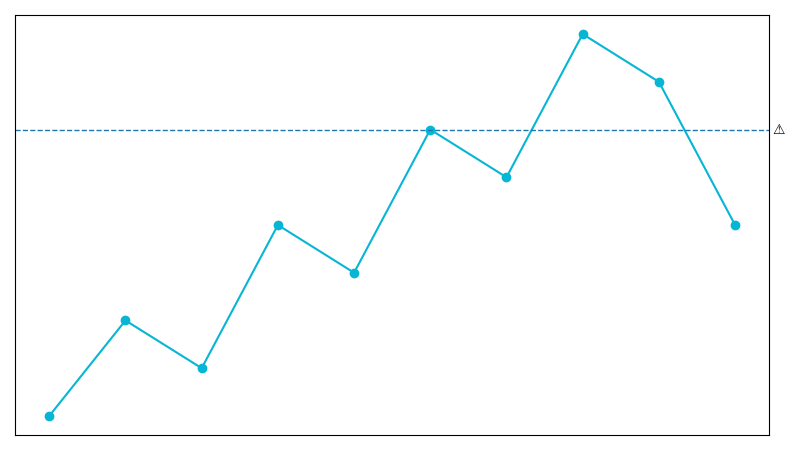
The platform calculates CL, AL, and Form automatically from uploaded training data. The Performance Management Chart displays all three metrics over time, providing a visual record of fitness progression, fatigue accumulation, and readiness.
The AI coaching layer adds forward-looking analysis. It can flag planned training weeks that would push Form to risky levels, or identify periods where CL has plateaued and additional stimulus may be warranted.
Getting Started
For athletes new to load monitoring, the process is straightforward. Record every workout with power or heart rate data so the platform can calculate training stress scores. Review the Performance Management Chart weekly to understand trends. Plan recovery when Form drops below -20. Before key races, begin tapering 10 to 14 days out, targeting Form values of +10 to +20.
Over time, comparing these numbers to how you feel on a given day builds useful internal calibration. The metrics do not replace self-awareness; they complement it.
Referenzen
Banister, E. W., Calvert, T. W., Savage, M. V., & Bach, T. (1975). A systems model of training for athletic performance. Australian Journal of Sports Medicine, 7, 57-61.
Bosquet, L., Montpetit, J., Arvisais, D., & Mujika, I. (2007). Effects of tapering on performance: A meta-analysis. Medicine & Science in Sports & Exercise, 39(8), 1358-1365.
Busso, T. (2003). Variable dose-response relationship between exercise training and performance. Medicine & Science in Sports & Exercise, 35(7), 1188-1195.
Coggan, A. (2003). Training and racing with a power meter: An introduction. Unpublished manuscript, later incorporated into Allen, H., & Coggan, A. (2010). Training and Racing with a Power Meter (2nd ed.). VeloPress.
Foster, C. (1998). Monitoring training in athletes with reference to overtraining syndrome. Medicine & Science in Sports & Exercise, 30(7), 1164-1168.
Gabbett, T. J. (2016). The training-injury prevention paradox: Should athletes be training smarter and harder? British Journal of Sports Medicine, 50(5), 273-280.
Meeusen, R., Duclos, M., Foster, C., Fry, A., Gleeson, M., Nieman, D., … & Urhausen, A. (2013). Prevention, diagnosis, and treatment of the overtraining syndrome: Joint consensus statement of the European College of Sport Science and the American College of Sports Medicine. Medicine & Science in Sports & Exercise, 45(1), 186-205.
Mujika, I., & Padilla, S. (2003). Scientific bases for precompetition tapering strategies. Medicine & Science in Sports & Exercise, 35(7), 1182-1187.

Comments(0)
Sign in to join the conversation.